- Research
- Open access
- Published:
Identifying vertical partnership among automotive component companies: empirical evidence from automotive industry in Jabodetabek, Indonesia
Journal of Economic Structures volume 8, Article number: 33 (2019)
Abstract
The goal of this research is to examine the relation between technology transfer, technical exchange, government role, and supplier performance of automotive industry in Jabodetabek, Indonesia. There are 99 companies in this study, consisting of 6 assembler companies, 59 tier-1 companies, and 34 tier-2 companies. The research was conducted by visiting sites and filling questionnaires based on Likert scale to the person in charge at middle-up management level who understand or is responsible for measuring product quality (purposive sampling). The result of the questionnaires was processed and analysed by partial least square path modelling (PLS-PM), using Smart PLS 3.2.7 software. The result showed that there was a significant impact of government role to technology transfer (p value 0.000), technology transfer to supplier performance improvement (p value 0.056), and technical exchange to supplier performance improvement (p value 0.074). However, there was no significant impact of government role to supplier performance improvement (p value 0.179).
1 Introduction
The automotive industry is a unique, complex, and dynamic industry. Its approximately 15,000–20,000 parts are assembled in the industry (Oliver et al. 2008), and it is a capital-intensive industry (Zapata and Nieuwenhuis 2010). Moreover, the automotive industry and its suppliers are highly dependent on each other (Veloso and Soto 2001). Due to the high amount of complicated components required, all companies, even the largest manufacturers, cannot produce the components themselves. They need other companies, called tier-1 and tier-2 companies, to supply them.
Indonesia, Thailand, Malaysia, and the Philippines are known as the ‘ASEAN-4 Cluster’ and are the dominant automotive players in Southeast Asia (Irawati 2012). Automotive production in the Association of Southeast Asian Nations (ASEAN) reached 3896,967 units in 2015 (Gaikindo 2016) and is an area that has expanded dramatically to exporting for the world’s leading automotive manufacturers (Ito and Umemoto 2004). In Indonesia, manufacturing in the automotive sector made up 28% of the manufacturing sector’s contribution to gross domestic product (GDP), second only to manufacturing of food products, which contributed 36% (see Fig. 1).

Source: Central Agency of Statistics of Indonesia (BPS) in JETRO (2015)
Contribution of manufacture and automotive industry to Indonesian economy.
According to the Association of Indonesia Automotive Industries (GAIKINDO), the year 2015 saw total ASEAN production of 3896,967 units and sales of 3070,488. Indonesia automotive industry accounted for 1098,780 units of vehicle production and sales of 1,013,291. In comparison, Thailand dominated vehicle production with 1,913,002 units and sales of 799,632. In the ASEAN market, Thailand, known as the ‘Detroit of Asia’, and Indonesia are in competition with each other (see Fig. 2).

Source: Association of Indonesia Automotive Industries (GAIKINDO) website
ASEAN-4 Cluster sales and production 2015.
As the volume of parts for supply and sales increases, increased competition is inevitable. Competition is fierce in the automotive industry, so one way to survive is to build solid supply chain management between buyers and suppliers. As automotive makers (assembler companies) holding international automotive brands face international competition, local suppliers (tier-1 and tier-2 companies) face demand to upgrade quality, cost, and delivery (Sadoi 2013).
In the buyer–supplier relationship, the performance of the supplier plays an important role, as their capability to produce good parts for the buyer increases the opportunity to defeat the competition at the end of the product stage. Moreover, lasting relationships (link durability) between buyer–suppliers has been the key to successfully winning competition in the global market (Cannon et al. 2010). The automotive industry has witnessed speedy technological change that requires high performance from suppliers, and the good performance of a supplier also leads to the buyer maintaining their relationship with the supplier (Doney and Cannon 1997). The buyer requires capable suppliers, while suppliers also require the buyer’s order. The above situations made suppliers increase their value they add, and buyer–suppliers interdependence also grows (Oh and Rhee 2008).
Meanwhile, several studies have revealed that government plays an important role in certain areas, such as technology transfer and supplier performance improvement, especially in developing countries. In the area of technology transfer, in the early stages, government often implements policies to protect industry, for instance by setting up minimum requirements for local content to guarantee that parts are produced locally. The Indonesian government established several policies to nurture the automotive industry, including the TKDN policy (tingkat kandungan dalam negeri) or local production policy for technology transfer from foreign partners (Dewanti 2012).
Besides designing policy, government also assists local supplier companies with capital investment, marketing, and human resources development (e.g. providing training) to improve supplier performance capabilities. A study conducted by Jan and Hsiao (2004) suggested that the administrations of developing countries should institute timely policies to ensure that the technology leveraging process runs smoothly. For the Indonesian government, improving the abilities of suppliers represented by tier-1 and tier-2 companies has played an important role in economic development.
Besides Thailand, Malaysia, and the Philippines, Indonesia is a key automotive supplier (of automotive spare parts) in the Southeast Asian (ASEAN) region (Ito and Umemoto 2004). The multinational enterprises (MNEs) of the automotive industry as buyers tend to increase their internationalized production network. One critical issue is the effect of supplier relationships between assembler companies (as buyers) and tier-1 and tier-2 companies (as suppliers) that influence to win competition from the fierce competition of the international market. With the objective of building a quick development process, lower input costs, and completed end-product quality, supplier performance improvement is a significant factor.
In Indonesia, Jabodetabek is a barometer of automotive industry, which is the main reason why this location was chosen for this research. Jabodetabek is the official name for the urban area surrounding the capital city of Jakarta. Jabodetabek stands for Jakarta, Bogor, Depok, Tangerang, and Bekasi Cities. The results of this study are expected to provide an interaction process between government role, technology transfer, technical exchange (between buyers and suppliers), and supplier performance improvement in the Indonesian automotive industry, particularly in the Jabodetabek area.
Based on the author’s fieldwork, almost all major automotive firms are located in Jabodetabek. Several major automotive firms are located outside Jabodetabek, like Toyota Motor Manufacturing Indonesia (TMMIN), Honda Prospect Motor, KIA Motor, Timor Motor, Nissan Motor, and Hino Mobil. However, their factories are located in Karawang, West Java, less than approximately 39 miles (63 km) from Bekasi (a city in the Jabodetabek area). Moreover, their headquarters are still located in the Jabodetabek area. At least 16 major automotive and nine major motorcycle makers operate in Jabodetabek. Additionally, most tier-1 and tier-2 supplier companies are also located around Jabodetabek; they produce automotive spare parts and focus on production processes like creation welding plants, casting plants, stamping plants, and engine plants. According to data from KIKO (Indonesian Automotive Component Industry Cooperative), automotive companies in Indonesia consist of 27 assembler companies (OEM), 245 tier-1 and tier-2 companies, and 950 tier-2 and tier-3 companies (JETRO 2015).
Similar to the other automotive structures in other countries, the Indonesian automotive supply chain structure is essentially divided into three layers. Each has different functions and responsibilities. The pyramid supply chain structure in the automotive industry can be described as follows:
-
The first layer is the automotive maker (assembler companies). An assembler company, also called an OEM (original equipment manufacturer), sits at the top of the automotive supply chain pyramid. An assembler company is a manufacturer that makes end-products for the consumer marketplace. There are several assembler companies operating in Indonesia; they are usually international automotive brands from Japan, Germany, South Korea, Malaysia, or India. However, the most dominant assembler companies operating in Indonesia are Japanese.
-
The second layer is made up of tier-1 companies. Tier-1 companies are first-hand suppliers to assembler companies. These are especially prominent in the automotive industry and relate to major suppliers of parts to assemblers.
-
The third layer includes tier-2 companies. Tier-2 companies supply automotive parts directly to tier-1 companies and do not provide automotive parts directly to assembler or OEM companies. However, in many cases, a company may be a tier-1 supplier to one business entity and become a tier-2 supplier to another business entity, or they may be a tier-1 supplier for a specific product and a tier-2 supplier for a non-identical product line. For cases in Indonesia, most tier-2 companies are categorized as small- and medium-sized enterprises (SMEs) (Fig. 3).
Fig. 3 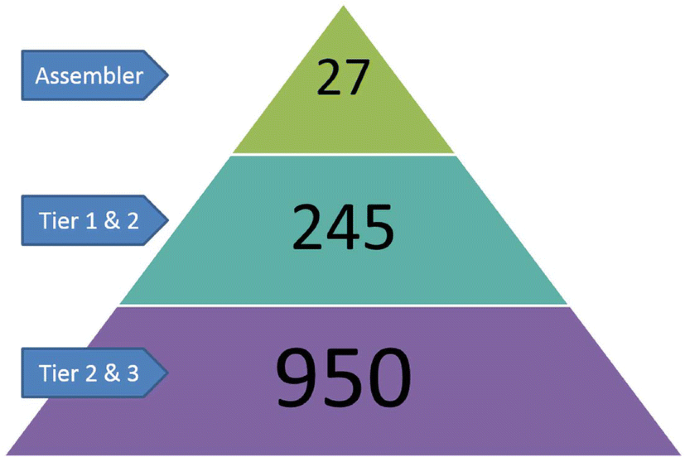
Source: Based on interview of Indonesian Automotive Component Industry Cooperative (KIKO) of Indonesia and Japan Economic Research Institute Inc (JETRO). Asian Industrial Foundation Development Research in FY 2014: Fact Finding Survey on Local SMEs in Indonesia Japan Economic Research Institute Inc. (2015)
Pyramid structure of automotive industry in Indonesia.

This study intended to widen the scope of previous researches that focus only the relation between tier-1 and tier-2 of automotive firms in Indonesia (Syah 2019). The goal of this study is to examine the relations between the four dimensions of technology transfer, technical exchange, government role, and supplier performance improvement in the automotive industry in Jabodetabek, Indonesia. The study aims to: (1) examine the relation between government role and technology transfer; (2) identify the relation between government role and supplier performance improvement; (3) examine the relation between technology transfer and supplier performance improvement; and (4) identify the relation between technical exchange and supplier performance improvement. Jabodetabek has been chosen as the field area for the research because, besides the fact that most major automotive and motorcycle assemblers are located in this area, production units of many supplier companies in the automotive industry are located in Jabodetabek.
Despite the fact that there are some limitations to this research, this study contributes to the current literature in several areas, such as being a comprehensive study of the vertical relation among assembler, tier-1, and tier-2 companies in the automotive field, the role of technology transfer, technical exchange to supplier performance improvement, and the role of (the Indonesian) government in the automotive industry. The contribution of the study is unique as, first, the scope of previous researches focused only on the vertical buyer–supplier relationship between assembler and tier-1 companies; in this study, the author included tier-2 companies as respondents. Second, the study does not merely focus on the buyer–supplier relation, but also on the role of government.
Below is a literature review. This is followed, in part three, by an explanation of the collection of primary data and the methodology. Finally, the discussion, conclusion, and ideas for future research are described in sections four and five.
1.1 Literature review
The literature review plays an important part in this study because it provides background information related to the research of various scholars into supplier–buyer relations in automotive industries. The structure of the literature review is based on the key themes mentioned above in the abstract, involving the description of the general terms of technology transfer, technical exchange, government role, and supplier performance improvement. First, the overall picture of this study focuses on the relation between technology transfer, technical exchange, and supplier performance improvement in the automotive industry in the Jabodetabek area of Indonesia. By emphasizing the whole picture, it is hoped that this study will give a clear picture of relations among them. Second, this study also uses various government roles to examine the significance of its relation to technology transfer and to supplier performance improvement.
1.2 Government role
The government plays an important role in the implementation of industrial policy in automotive industry. In this study, government role is defined as the support of government especially in area of technology transfer and supplier performance improvement in the automotive industry. Therefore, the role of government is examined by the players in the automotive industry (from assembler to tier-2 companies). Several policies conducted by the government receive different responses from the players in the automotive industry.
In China, one study conducted by Chu (2011) suggested that governments in developing countries should institute timely policies to encourage collaboration between foreign and domestic automotive firms to help the technology leverage process in the domestic market. The author also found that the Chinese government (central state government) may have been ineffective in the beginning; however, the government continued to improve its policies to gain consensus by providing performance standards in the automotive industry.
Meanwhile, in India, Tiwari et al. (2011) found that government role is not specifically defined; however, they mentioned the government’s role in creating policies that shaped the industry in a significant way. The study carried out by Tiwari et al. (2011) found that government played an important role in the evolution of the Indian automotive industry, especially in the third phase (1980-1990) and fourth phase (after 1991 onward), when the Indian government launched the ‘infusion of the new technology’ in phase three, and ‘liberation with regard to foreign investment’ in phase four, which had a key influence on the Indian automotive industry.
In Thailand, which is one of the most important automotive players in Southeast Asia, one study (Lecler 2002) shared that the Thai government never tried to build a ‘national car industry’ and focused more on the parts industry. According to a study by Lecler (2002), government role in Thailand emphasized core assembling and exporting parts to other ASEAN countries. Government incentives and focus on infrastructure made Japanese manufacturers of automotive and parts interested in coming to Thailand. Finally, European manufacturers also followed their Japanese counterparts by entering the Thai automotive industry.
In this study, indicators of government role in this research consist of sufficient training, promotion, tax incentives, local content policies, and performance support in Indonesia.
1.3 Technology transfer
Numerous studies looking at technology transfer have tended to approach the subject from the perspective of automotive industries, as every industry is unique. The concept of technology transfer has been studied from many perspectives. Kotabe et al. (2003) defined technology transfer as a collaborative relationship that permits one partner to look into and duplicate full technological qualification of the other partner. In this case, technology transfer is from an assembler company to tier-1 and tier-2 companies.
Meanwhile, Tidd et al. (2011) described technology transfer as a point-to-point phenomenon that turns knowledge to implementation. Moreover, Collins (1991) added that technology transfer includes bigger areas of activities and higher-level organization, meaning technology transfer covers areas of commercial technology movement from a buyer company to supplier companies.
Therefore, in the implementation scope, technology transfer requires cooperation, as large and functionally different groups act together inside and outside firms for a sustained period of time (Galbraith 1990). As technology transfer is one factor for consideration in the automotive industry, the author proposes the following hypothesis: there is a significant relationship between technology transfer and supplier performance improvement.
1.4 Technical exchange
The automotive industry is unique. Besides its rapid technological changes, the automotive industry demands greater capabilities. Sometimes, with the objective of meeting the high requirements of automotive spare parts, a very active assembler–supplier collaboration is needed. In this research, the terminology of buyer–supplier interaction, especially in technical matter, is technical exchange. Kotabe et al. (2003) defined technical exchanges as the collaboration between buyers and suppliers that includes continuing mutual adaption between buyers’ and suppliers’ design and production operations. Sometimes, the adaption comes about through one-to-one personnel relationships and the explicit sharing of engineering knowledge. In the field, technical exchange frequently happens in B2B (business-to-business) within the supplier–buyer relationship. The reciprocal relationship happens because they need each other. Buyers build technical exchange because they want to get spare parts that meet their requirements, while on the other hand, suppliers try to supply the best parts to buyers, in order to keep their contracts.
Based on Oh and Rhee’s (2008) Hyundai–KIA tier-1 research, suppliers with design capabilities can vitalize manufacturer–supplier collaboration (technical exchange). A manufacturer in this study refers to an assembler company. It can be inferred that the assembler–supplier relation plays a vital role in building better cohesion. There are several areas where buyers and suppliers can collaborate with each other. In the Hyundai–KIA tier-1 study, the term technical exchange refers to communication, problem solving, and strategic purchasing.
Meanwhile, in the buyer–supplier case of Toyota in the USA and Japan, Dyer and Nobeoka (2000) found that the network between buyers and suppliers (technical exchange) can be more productive. Perhaps both parties realized that production knowledge is seen as the property of the network, not belonging to an individual firm. Another study also found that technical assistance from a supplier is one determinant on trust in supplier relations (Sako and Helper 1998). Bonte (2008) also found that sharing knowledge spillovers from customers/buyers is useful in building on trust with suppliers.
In this study, the technical exchange dimension will include indicators including close relationships, bilateral communication, frequent contact, informal discussions, communication in the early development process, and informal communication’s impact on reducing lead time. Given the preceding discussion, the following hypothesis is proposed: there is a significant relationship between technical exchange and supplier performance improvement.
1.5 Supplier performance improvement
Competition in the automotive industry is very tight and severe, so assembler companies demand suppliers with capabilities that meet their requirements. Supplier companies that stay up-to-date with international standards stay in business. Performance improvement is inevitable in the automotive industry. According to Kotabe et al. (2003), the term supplier performance improvement means operational activities that are measured in four dimensions: product design, process design, product quality, and (ability to reduce) lead time. The study carried out by Kotabe et al. (2003) measured tier-1 companies’ supplier performance improvement benchmarking between US and Japanese supplier companies.
According to a study by Cannon et al. (2010), there are three reasons why overall supplier performance is pivotal to a buyer firm’s evaluation: (1) relative price/cost; (2) product/service performance; and (3) delivery performance. As the amount of a buyer’s profit is dominated by the amount they spend on buying goods, buyers will evaluate long-term relationships with suppliers based on price/cost.
With the objective of coming up with improved supply chain optimization performance, all participants (suppliers and buyers) should be concerned with and obligated to work to a common goal like customer satisfaction in the entire supply chain and improved competitiveness (Gunasekaran et al. 2004).
In this study, the dimension of supplier performance improvement is scrutinized using four main indicators: (1) improving product design; (2) improving process design; (3) improving product quality; and (4) reducing lead time. The four indicators above have been adopted from a previous study (Kotabe et al. 2003). In this study, supplier performance improvement is used as a dependent variable.
1.6 The conceptual framework
In order to make it easier to understand this research, our theoretical framework that has been designed is shown in Fig. 4.

Source: Author
Conceptual framework.
2 Methods
2.1 Hypotheses
Given the preceding theoretical review section, the following hypotheses are proposed:
H1
There is a significant relationship between government role and technology transfer.
H2
There is a significant relationship between government role and supplier performance improvement.
H3
There is a significant relationship between technology transfer and supplier performance improvement.
H4
There is a significant relationship between technical exchange and supplier performance improvement.
The research objective of this study is to examine the relation of technology transfer, technical exchange, government role, and supplier performance improvement in the automotive industry in Jabodetabek, Indonesia. Most of the studies outlined in the literature review focused on evidence of buyer–assembler relations outside Jabodetabek, Indonesia. Other researchers did not cover the case of the automotive industry in Indonesia. Besides, previous research that investigated buyer–assembler relations and supplier performance did not cover the role of government policy in the automotive sector. Therefore, previous studies were only partially examined. In order to examine the issue comprehensively, this study proposes to investigate an alternative automotive industry case in Jabodetabek.
2.2 Sample and criterion variable
In order to examine the relation among technology transfer, technical exchange, government role, and supplier performance, the author conducted a questionnaire survey to players at all levels of the supply chain (assemblers, tier-1 companies, and tier-2 companies) in the car and motorcycle industry of Jakarta and four surrounding cities: Bogor, Depok, Tangerang, and Bekasi. The questionnaire was distributed to a list taken from PIKKO (Medium-Sized Automotive Component Companies of Indonesia) and KIKO (Indonesian Automotive Component Industry Cooperative) for tier-2 companies; both institutions are automotive associations.
In an industrial survey, like that of this study, it is considered discrete to sample all corporate entities in the population to ensure representativeness (Lehman 1985). In the beginning, it was quite difficult to get exact population data from the government (Ministry of Industry and Ministry of Cooperative and Small–Medium Industry), so the author took data from PIKKO and KIKO stated in Japan Economic Research Institute Inc. (2015). As mentioned earlier, based on PIKKO data, there are 1222 automotive part companies in Indonesia. If using the sample formula as follows:
where population N 1222, accuracy E 0.10, population rate P 0.5, constant K 1.96, minimum sample size N 90, then based on the above calculation, the minimum number of respondents for the sample is 90 respondents. The list contacted was provided by PIKKO and KIKO, and field research was conducted from September 2015 until February 2017. Once the respondents consented to respond to the survey after being contacted, the author and a team of interviewers went directly to the company to do the interview and ask them to fill in the questionnaire. A questionnaire was developed in Bahasa Indonesia and English to ask a broad range of questions relating to the nature of suppliers’ vertical relations. More than 150 companies were contacted to be respondents. However, only 99 companies agreed to participate in this study. Respondents consisted of six assembler companies, 59 tier-1 companies, and 34 tiers-2 companies. As the response rate for this study was more than the minimum requirement, the findings of this research are representative of the entire automotive industry population in Jabodetabek.
In an industrial survey such as the one used for this study, it is considered discrete to sample all corporate entities. The primary objective of this study was to identify the relation between technology transfer, technical exchange, government role, and supplier performance improvement. Consequently, it is necessary that the respondents (interviewees) representing assemblers and supplier companies are ‘the right person’ to be interviewed, in order to avoid bias and misleading results. Therefore, there were additional requirements of respondents (interviewees) in this research:
-
1.
The representative respondent who answers the questionnaire should be the owner, head of production, or Director, and have the authority to measure technical aspects of products in the company.
-
2.
Automotive respondents should have operated for at least two years.
-
3.
Automotive respondents must have supplier companies.
2.3 Latent variables and indicators
In this study, there are four latent variables (constructs) with five indicators of government role, four indicators of technology transfer, six indicators of technical exchange, and four indicators of supplier performance improvement.
Basically, the contents of questionnaires of Kotabe et al. (2003) focused on the relationship of technology transfer and technical exchange to supplier performance improvement. Kotabe wants to emphasize the scope of value adding the relationship between buyer and supplier. Indicators in technology transfer stressed on how the capabilities that especially related to higher technology level that is harder to develop to be shared or transferred to a partner (suppliers) from a buyer in collaborative process. Based on indicators of technology transfer above, terminologies such as ‘sharing’, ‘transferring’, and ‘deploying’ technology to partner’s behalf become key issues. Meanwhile in technical exchange, the indicators focus on continuously mutual adjustment between buyer and supplier in production operations. Because technical exchange entails small-scale exchange information, terminologies such as ‘close relation’, ‘regular contact’, ‘communication’, and ‘informal communication’ became central issues. In supplier performance improvement indicators, Kotabe emphasizes on improvement in supplier’s performance improvement over the last 2–3 years. Operational performance in this case refers to ‘product design’, ‘process design’, ‘product quality’, and ‘reducing lead time’. Kotabe’s approach has been implemented to measure the relation of suppliers and buyers in USA and Japan. Of government role, the author uses indicators based on preliminary discussion to government and the association board of PIKKO and KIKO in Indonesia. In this study, indicators of government role in this research consist of sufficient training, promotion, tax incentives, local content policies, and performance support in Indonesia. As mentioned above, the role of (the Indonesian) government in the automotive industry in this study is one of the author’s interests. Details both Kotabe approach and preliminary interview with automotive players in Jabodetabek shown in Table 1.
2.4 Statistical method
All multi-item measured questionnaires were based on a five-point Likert scale. The data were processed with PLS-PM (partial least square path modelling) using Smart PLS 3.0 software. Partial least squares are a group of regression-based methods designed for the analysis of high-dimensional data in a low-structure environment (Chin 2010 in Vinzi et al.). The partial least square approach to structural equation modelling (SEM), or PLS path modelling, initially developed by Wold (1966, 1982, 1985) and Lohmöller (1989), proposes an alternative to the more important and well-known covariance-based modelling (Monecke and Leisch 2012). Data characteristics like minimum sample size, non-normal data, and scale of measurement are among the most often stated reasons for applying PLS-PM (Hair et al. 2012; Henseler et al. 2009).
There are several reasons why this study used PLS-PM. First, this study involved several latent variables, so the ideal method for this case is PLS-PM. Second, in the PLS-PM method, there is no prerequisite for a minimum sample. For instance, the SEM method has a minimum requirement sample of 100–150 (Schumacker and Lomax 2010). This study used around 100 samples, so PLS-PM is a fit for this research.
A PLS-PM comprises two elements. First, there is a structural model (used to call the inner model in the context of PLS-PM) that defines the constructs. The structural model also shows the connection (paths) between the constructs. Second, there are the measurement models (also referred to as the outer models in PLS-PM) of the constructs that define the connection between the constructs and the indicator variables (Hair et al. 2014) (Fig. 5).

Source: Author Data
Structural model and measurement model.
2.5 Evaluation measurement model
Measurement models are evaluated according to convergent validity, discriminant validity, and internal consistency reliability. Convergent validity is the extent to which a measure connects positively with alternative measures of the same construct. To demonstrate convergent validity, researchers consider the outer loadings of the indicators, as well as the average variance extracted (AVE). An AVE value of 0.50 or higher indicates that, on average, the construct illustrates more than half of the variance of its indicators (Chin 1998; Hair et al. 2014).
Discriminant validity is the extent to which a construct is truly different from other constructs by empirical standards. Two measures of discriminant validity have been proposed. One method for assessing discriminant validity is by testing the cross-loadings of the indicators (Henseler et al. 2015); the second is the Fornell–Larcker criterion (Hair et al. 2014). The cross-loadings were used in this research.
Internal consistency is measured through two criterions. The first criterion to be determined is typically internal consistency reliability. The traditional criterion for internal consistency is based on Cronbach’s alpha, which supplies an appraisal of the reliability based on the interrelations of the observed indicator variables (Sage Publication 2017). The second is composite reliability. The composite reliability varies between 0 and 1, with higher values showing higher levels of reliability. Particularly, composite reliability values in the range of 0.60 to 0.70 are adequate in exploratory research; meanwhile, in the case of more high-level research, values ranging between 0. 70 and 0.90 are considered satisfactory (Nunnally and Bernstein 1994). However, values above 0.90 (and definitely > 0.95) are not desirable because this shows the whole indicator variables to be examining the same phenomenon and, for that reason, it is not a fit measurement of the construct.
2.6 Accessing structural model
The structural model is accessed by an R-square value and goodness of fit (GoF). The most familiar measurement for judging the structural model is the coefficient of determination (R-square value). This coefficient is a measure of the model’s predictive accuracy and is examined as the squared correlation between the special endogenous construct’s actual and predicted values. The R-square value ranges from 0 to 1 with higher levels considered to show higher levels of predictive accuracy (Hadi et al. 2016).
Tenenhaus et al. (2005) proposed a PLS goodness-of-fit (GoF) index as ‘an operational solution to this problem as it may be meant as an index for validating the PLS model globally’. The goodness of fit (GoF) describes how well the model meets a set of observations. The greater the value of GoF, the better the fit of the model.
3 Results
3.1 Respondents’ profiles
As mentioned above, the total of number of respondents was 99 companies (N=99). This consists of six assembler companies, 59 tier-1 companies, and 34 tier-2 companies. The respondents’ profile details are displayed in Table 2.
Most of the respondent sales are in the range of 2.5 trillion to less than 50 trillion IDR (Indonesia Rupiahs); this covers 35.7% of respondents. The second range is more than 50 trillion IDR. The sales codification above is based on the Ministry of Cooperative and Small–Medium Enterprises of Indonesia range. Around 13.3% of respondents declined to give an answer.
The majority of respondents are from Bekasi City (76.6%), followed by DKI Jakarta City in second place (10.2%), with the smallest number of respondents coming from Depok City (1%). Based on field observations, it is understandable that Bekasi contains the majority of respondents, as there are several industrial areas in Bekasi City. The author observed that there are at least seven industrial areas in Bekasi City: PT Hyundai Inti Development Park Dae Woo, PT Bekasi Fadjar Hungkang, PT Cikarang Industrial Estate (Jababeka), PT Lippo Cikarang, PT East Jakarta Industrial Park (EJIP), PT. Delta Mas, and PT Megapolis Manunggal Industrial Development (MM2100).
Regarding the link duration of the supplier–buyer relationship, the share of distribution is equally distributed. The highest link duration is a 5–10-year relationship (33.7%), followed a 3–5-year relationship (20.4%) and a 10–15-year relationship (18.4%), as shown in Table 2.
Based on the author’s field research, most assembler companies are located in Jakarta. In order to access end-customer, it is understandable most assembler (OEM) companies decided to locate the headquarters and production base in Jakarta. Meanwhile for supplier most tier-1 and tier-2 located outside Jakarta city, their production base mostly located in Bekasi (more than 75%). Detail number of tier-1, tier-2 and assembler are shown in Table 3. One reason why tier-1 and tier-2 companies are located outside Jakarta city, looking for cheaper land price that too expensive in Jakarta City and also seeking minimum regional wages (UMR) lower than Jakarta City. Based on observation, the author found that most tier-1 companies have characteristics like their product is more sophisticated, specific, and complex than those of tier-2 companies. Most tier-1 productions are located in industrial park, especially that located in Bekasi City. Several tier-1 companies are joint-venture companies (for example partnership companies between Indonesia and Japan). Meanwhile, tier-2 companies relatively are smaller than tier-1 companies; most of them produce more ‘general product’ and relatively implement smaller technological content. Several tier-2 companies typically have ‘workshop-style’ place and have limited and smaller machines compared to tier-1 companies. Most of the tier-2 companies are owned by local people (Indonesian), and the owner/head of tier-2 companies used to work to assembler or tier-1 companies before.
4 Results
In PLS-PM, there are two models that are evaluated, the outer model and the inner model. The purpose of evaluating the outer model is to examine the relation between indicators and their latent variables. Meanwhile, the evaluation goal of the inner model is to measure the relation among latent variables (Hair et al. 2014).
The validity scores of indicators are measured by loading factors, cross-loading, and AVE. An indicator is valid if it has a loading factor of > 0.7, cross-loading is valid if each indicator that measures latent variables has a higher score than other constructs, and the AVE score is > 0.5 (Hair et al. 2014; Abdillah and Jogiyanto 2015).
Based on the results of the processed data, all loading factors are > 0.7, except for loading factor TE6 (0.62, which means < 0.7). So, for this study, indicator TE6 does not drop out because its latent variable has an AVE score > 0.5 (Details presented in Table 4).
4.1 Convergent validity test
The results of the AVE scores showed that all latent variables have an AVE score of more than 0.5. This means that all indicators are valid, as shown in Table 5.
4.2 Discriminant validity
The purpose of discriminant validity is to test that an indicator that measures one latent variable is not used for other latent variables. The result of discriminant validity in Table 6 shows that each cross-loading of a latent variable is higher than other latent variables. It means that a latent variable and the indicators implemented in this research fulfil the requirement of discriminant validity. The italic values of variable show that the values are bigger comparing to other variable, Table 6 shows that indicators from GR1 until GR5 are fit to measure the latent variables of government role, SPI1 until SPI4 indicators are fit to measure the latent variables of supplier performance improvement, TE1 until TE6 indicators are fit to measure the latent variables of technical exchange, and TT1 until TT4 indicators are fit to measure the latent variables of technology transfer. All measurements that are not supposed to be connected are not actually unconnected (Details are proved in Table 6).
4.3 Internal consistency reliability test
Reliability test refers to the degree to which a test is compatible and consistent in measuring what it is expected to measure. Reliability test uses Cronbach’s alpha and composite reliability. A set of indicators is reliable if it has a Cronbach’s alpha value of more than 0.7 and a composite reliability value of more than 0.7. Table 7 shows that all sets of indicators are reliable, meaning indicators are consistent and stable in measuring latent variables.
4.4 Path coefficient test
Path coefficient test is a tool to measure the influence between latent variables. The criteria decision is measured by:
Reject H0 if t value > t table or reject if p value < alpha (0.1).
If the p-value is less than 0.1, the path coefficient is significant.
Based on the data shown in Table 8, the study found that:
-
1.
There is a significant impact of government role (GR) on technology transfer (TT). The p value is 0.00 in Table 7. So, the first hypothesis (H1) of this study shows a positive relationship between government role and transfer technology.
-
2.
There is no significant impact of government role (GR) on supplier performance improvement (SPI). The p-value is 0.179 > 0.1, meaning that the path coefficient is bigger than 0.1. So, the second hypothesis (H2) of this study shows no significant impact of government role on supplier performance improvement.
-
3.
There is a significant impact of technology transfer (TT) on supplier performance improvement (SPI). The p-value is 0.056 based on the result above. So, the third hypothesis (H3) of this study shows a positive relationship between technology transfer and supplier performance improvement in alpha 10%. This means that its implication is not as strong as the impact of government role (GR) on technology transfer (TT).
-
4.
There is a significant impact of technical exchange (TE) on supplier performance improvement (SPI). The p-value is 0.074 based on the result above. So, the fourth hypothesis (H4) of this study shows a positive relationship between technical exchange and supplier performance improvement in alpha 10%. Similar to the impact of TT on SPI above, the impact of technical exchange (TE) on SPI is also not as strong as the impact of government role (GR) on technology transfer (TT).
The results of the overall research are described below:
Structural Eq. 1
Structural Eq. 2
Goodness-of-fit (GoF) model = 37.03%. As such, this means that the overall result of this research can explain 37.03% of the relation among government role, technology transfer, technical exchange, and supplier performance improvement. If the result of the GoF model value is more than 0.36, it is categorized as a ‘good model’ according to Wetzels et al. (2009).
5 Discussion
The results of the analysis examining the linkage between government role and technology transfer are shown in Fig. 6, indicating that there is a positive influence of government role on transfer technology. The significant role of government on transfer technology is consistent with the prior research cases of China (Chu 2011), India (Tiwari et al. 2011), the case of the Thai car industry (Lecler 2002), and the case of Malaysia (Sadoi 2013). In the case of the automotive industry in Jabodetabek, Indonesia, the study found that government role has a significant impact on transfer technology. Besides solid government role, especially in the area of policy, based on field investigation, the author also sees the influence of Japanese technology transfer and human resource qualities as playing an important role. Most of the assembler, tier-1, and tier-2 companies that operate in Jabodetabek are affiliated with Japanese companies. The role of Japanese industrialization was largely accumulated in the automotive industries. Results from observation in the field are similar to previous studies (Koike and Inoki 1990; Busser and Sadoi 2004). The other factors also show that many highly competent human resources working in the industries also played a significant role. Many employees who work in the automotive industry in Jabodetabek have strong professional backgrounds. However, the study also found insignificant implications between government role and supplier performance improvement in the automotive industry in Jabodetabek. Based on field observations and interviews with respondents, the author has several possible explanations. First, several respondents, especially from tier-2 companies, revealed that training assistant programs provided by government to their employees did not meet their needs. Many tier-2 companies are from small–medium-sized companies, as providing technical training is beyond of the budget of many tier-2 companies. Tier-2 companies expect the latest technical training support from government. Government provides technical training for SMEs. However, it seems that government’s training support does not meet their expectations. Second, several respondents of tier-2 companies also insisted that government should provide more soft loans to back up their businesses. Competition in the automotive industry is extremely fierce. Meet to tier-1 company requirements or orders and improving their speed, accuracy, quality, cost and delivery (QCD) are strategic necessity. They mentioned that soft loan availability was needed mostly to buy new technology (machines, tools, etc.) and for working capital if they receive high quantities of goods from buyers (tier-1 companies).

Source: Author Data, Smart PLS 3.2.7
Result.
The study also revealed that, even though it is not high, the technology transfer process inside automotive industry in Jabodetabek has a positive impact on supplier performance improvement. As mentioned earlier, the role of Japanese industrialization was accumulated largely in the automotive industry in the Jabodetabek area, while the author’s observations also revealed that acquisition skill and investment in human resources played a significant role. Several tier-2 owners met by the author in the Jabodetabek cluster area are ‘alumni’ of Japanese automotive groups. They worked in one of the automotive companies for several years before building their own supplier company (tier-2). This phenomenon shows that the acquisition process and investment in human resources have occurred in the automotive industry in the Jabodetabek area. This phenomenon also happened in the case of the Malaysian automotive industry (Sadoi 2013).
Last, this study also found that there was a positive relation between technical exchange and supplier performance improvement. The relation between technical exchange and suppliers–buyers relationship in Jabodetabek is strong enough, especially the relation between assembler and tier-1 companies. This condition has been validated by Irawati and Charles (2010) who conducted research regarding involvement of MNEs in the Indonesian automotive cluster. In some cases, to inspect and to guarantee the quality of the product, they exchange information among their technical staff. The high frequency of contact between them builds a level of trust between each other. This result has similarity to a previous study showing that incoming knowledge spillovers from buyers positively affect supplier trust in the vertical relationship in the Jabodetabek automotive cluster (Bonte 2008). Also, this result confirmed the finding reported by Sako and Helper (1998), where information movement to suppliers was shown to have a positive impact on trust; moreover, successful alliances between companies led to beneficial technology transfer and knowledge between them in the case of the Iranian automotive industry (Rezazadeh and Mahjoub 2016).
6 Conclusion
This study reveals that the study regarding the identification of vertical partnerships in the automotive sector in Jabodetabek, Indonesia, has significant relations between government role and technology transfer, technology transfer and supplier performance improvement, and technical exchange and supplier performance improvement. However, there was no significant relation between government role and supplier performance improvement.
-
1.
There is a significant impact of government role on technology transfer. This means that the Indonesian government has played a significant role in the transfer of technology in the automotive sector in Jabodetabek. Assembler, tier-1, and tier-2 companies perceive that the Indonesian government plays a significant role. In a nutshell, government role has a positive influence on technology transfer. Moreover, government role has successfully initiated technology transfer.
-
2.
The study found that there was no significant role of government in supplier performance improvement. The assembler, tier-1, and tier-2 companies do not think or perceive that government role significantly affects supplier performance improvement.
-
3.
The variable of technology transfer has a positive impact on supplier performance improvement. It means that even in small quantities, transfer of technology from assembler companies to tier-1 companies and from tier-1 companies to tier-2 companies positively increases their supplier performance improvement in Jabodetabek, Indonesia.
-
4.
There is a significant impact of technical exchange on supplier performance improvement. Technical exchange from assembler companies to tier-1 companies and from tier-1 companies to tier-2 companies leads to their performance improvement.
6.1 Recommendations
Recommendations in this research are addressed to all management employees of automotive companies in Jabodetabek, Indonesia, automotive associations (PIKKO and KIKO), and Indonesian government institutions like the Ministry of Industries (Kemenperin) and the Ministry of Cooperative and Small–Medium Enterprises (Kemenkop UKM). All these institutions are expected to contribute their full support to the automotive industry, especially in the face of fierce competition in the ASEAN Economic Community that began at the start of 2016.
In order to strengthen local automotive industries, tier-2 companies in particular, of which the majority are SMEs, government should actively conduct technical skills training based on their continuous needs. Based on interviews with respondents, tier-2 companies also need business mentoring facilitation by government. The author also suggests that government should initiate an industrial bank that has a special purpose of providing affordable loans to them, since most of them are SMEs.
7 Future research
The empirical results of the present investigation of the Indonesian automotive industry offer insights for further research. First, it is recommended that future research should measure more specific relations between assembler and tier-1 companies and between tier-1 companies and tier-2 companies. Because each tier-1 and tier-2 company has a different economic scale and financial capabilities, differentiated measurement between them will give more comprehensive results. Second, since this study found that there was a negative relation between technology transfer and supplier performance improvement, further elaborating research is needed to find the main cause.
Availability of data and materials
All the data sets generated and analysed during the current study are not publicly available because many respondents requested that the author does not publish their identity in this study. However, all data sets (especially detail characteristics, data of companies/respondents) are available from the corresponding author on reasonable request.
References
Abdillah W, Jogiyanto HM (2015) Partial least square: alternatif structural equation modelling (SEM) Dalam Penelitian Bisnis, 1st edn. Penerbit Andi, Yogyakarta
Bonte W (2008) Inter-firm trust in buyer-supplier relations: Are knowledge spillovers and geographical proximity relevant? J Econ Behav Organ 67(2008):855–870. https://doi.org/10.1016/j.jebo.2006.12.004
Busser R, Sadoi Y (2004) Production network in Asia and Europe. Routledge, London
Cannon JP, Doney PM, Mullen MR, Petersen KJ (2010) Building long-term orientation in buyer-supplier relationships: the moderating role of culture. J Oper Manag 28(2010):506–521. https://doi.org/10.1016/j.jom.2010.02.002
Chin WW (1998) The partial least square approach for structural equation modeling. In: Marcoulides G (ed) Modern methods for business research. Lawrence Erlbaum Associates, London, pp 95–336
Chin WW (2010) Bootstrap cross-validation for PLS path model assessment’. In: Vinzi VE et al (eds) Handbook of partial least square: concept, methods, and application. Springer, Berlin, pp 83–98. https://doi.org/10.1007/978-3-32827-8
Chu WW (2011) How the Chinese government promoted a global automobile industry. Ind Corp Change 20(5):1235–1276. https://doi.org/10.1093/icc/dtr010
Collins D (1991) A resource-based analysis of global competition: the case of bearings industry. Strateg Manag J Summer Spec Issue 12:49–68
Cronbach LJ (1951) Coefficient alpha and the internal structure of tests. Psychometrika 16:294–334
Dewanti EH (2012) Persyaratan Kandungan Lokal (Local Content Requirements) di Indonesia dan kaitannya Dengan Perjanjian Internasional di Bidang Investasi. Yuridika 27(3):203–216. https://doi.org/10.20473/ydk.v27i3.300
Doney PM, Cannon JP (1997) An examination of the nature of trust in buyer-seller relationship. J Mark 62(2):35–51. https://doi.org/10.2307/1251829
Dyer JH, Nobeoka K (2000) Creating and managing a high-performance knowledge-sharing network: the Toyota case. Strateg Manag J 21:345–367
Gaikindo (2016) Asian auto market and production 2015. http://gaikindo.or.id. Accessed 4 Jan 2017
Galbraith CS (1990) Transferring core manufacturing technologies in high-technology firms. Calif Manag Rev 32(4):56–70. https://doi.org/10.2307/41166628
Gunasekaran A, Patel C, McGaughey RE (2004) A framework for supply chain performance measurement. Int J Prod Econ 87(2004):333–347. https://doi.org/10.1016/j.ijpe.2003.08.003
Hadi NU, Abdullah N, Sentosa I (2016) Making sense of mediating analysis: a marketing perspective. Rev Integr Bus Econ Res 5(2):62–76
Hair JF, Sarstedt M, Pieper TM, Ringle CM (2012) The use of partial least squares structural equation modelling in strategic management research: a review of past practice and recommendations for future application. Long Range Plan 45(5–6):320–340
Hair JF, Hult GT, Ringle CM, Sarstedt M (2014) A primer on partial least squares structural equation modelling (PLS-PM). Sage, Los Angles
Henseler J, Sarstedt M (2013) Goodness-of-fit indices for partial least squares path modeling. Comput Stat 28(2):565–580. https://doi.org/10.1007/s00180-012-0312-1
Henseler J, Ringle CM, Sinkovics RR (2009) The use of partial least squares path modeling in international marketing. In: Sinkovics RR, Ghauri PN (eds) A new challenges to international marketing (advances in international marketing). Emerald Group Publishing limited, Bingley, pp 227–319
Henseler J, Ringle CM, Sarstedt M (2015) A new criterion for assessing discriminant validity in variance-based structural equation modelling. J Acad Mark Sci 43(1):115–135. https://doi.org/10.1007/s11747-014-0403-8
Irawati D (2012) Knowledge transfer in the automobile industry: global-local production network, 1st edn. Routledge, New York
Irawati D, Charles D (2010) The involvement of Japanese MNEs in the Indonesian automotive cluster. Int J Automot Technol Manag 10(2/3):180–196
Ito K, Umemoto S (2004) Intra-industry trade in the ASEAN Region: the case of the automotive industry. Working Paper Vol.2004-23, ASEAN-Auto Project No. 04-8, Senshu University-ICSEAD
Jan TS, Hsiao CT (2004) A four-role model of the automotive industry development in developing countries: a case in Taiwan. J Oper Res Soc 55(11):1145–1155. https://doi.org/10.1057/palgrave.jors.2601776
Japan Economic Research Institute Inc (JETRO) (2015) Asian industrial foundation development research in FY 2014: fact finding survey on local SMEs in Indonesia
Koike K, Inoki T (1990) Skill formation in Japan and Southeast Asia. University of Tokyo Press, Tokyo
Kotabe M, Martin X, Damoto H (2003) Gaining from vertical partnership: knowledge transfer, relationship duration, and supplier performance improvement in the US and Japanese automotive industries. Strateg Manag J 24:293–316. https://doi.org/10.1002/smj.297
Lecler Y (2002) The cluster role in the development of the Thai car industry. Int J Urban Reg Res 26(4):799–814
Lehman D (1985) Market research and analysis, 2nd edn. Irwing Publishing, Homewood
Lohmöller J (1989) Latent variable path modeling with partial least squares. Physica-Verlag, Heidelberg
Monecke A, Leisch IH (2012) SemPLS: structural equation modeling using partial least square. J Stat Softw 48(3):1–31
Nunnally J, Bernstein F (1994) Psychometric theory, 3rd edn. McGraw Hill, New York
Oh J, Rhee SK (2008) The influence of supplier capabilities and technology uncertainty on manufacturer-supplier collaboration: a study of the Korean automotive industry. Int J Oper Prod Manag 28(6):490–517. https://doi.org/10.1108/01443570810875331
Oliver N, Holweg M, Carver M (2008) A systems perspective on the death of a car company. Int J Oper Prod Manag 28(6):562–583
Rezazadeh A, Mahjoub M (2016) Alliance entrepreneurship and entrepreneurial orientation: the mediating effect of knowledge transfer. Gadjah Mada Int J Bus 18(3):263–284. https://doi.org/10.22146/gamaijb.22220
Sadoi Y (2013) Public-private partnership human resources development process in the automotive industry in Malaysia. Meijo Asian Res J 4(1):45–55
Sage Publications Inc. (2017) Assessing PLS-PM Result Part 1. https://au.sagepub.com. Accessed Sept 2017
Sako M, Helper S (1998) Determinants of trust in supplier relations: evidence from the automotive industry in Japan and the United States. J Econ Behav Organ 34(1998):387–417
Schumacker RE, Lomax RG (2010) A beginner guide to structural equation modeling. Routledge, New York
Syah DO (2019) Identifying the factor that promotes vertical partnerships: empirical evidence from Tier-1 and Tier-2 companies in Jabodetabek-Indonesia. Indones J Sci Technol 4(1):119–133. https://doi.org/10.17509/ijost.v4i1.14427
Tenenhaus M, Vinzi VE, Chatelin YM, Lauro C (2005) PLS path modeling. Comput Stat Data Anal 48(1):159–205
Tidd J, Bessant J, Pavitt K (2011) Managing innovation: integrating, technological, market and organizational change. Wiley, West Sussex
Tiwari R, Herstatt C, Ranawat M (2011) Benevolent benefactor or insensitive regulator? Tracing the role of government policy in the development of India’s automobile industry. East-West Center, Honolulu
Veloso F, Soto J (2001) Incentives, infrastructure and institutions: perspectives on industrialization and technical change in the late-developing nations. Techn Forecast Soc Change 66:87–109
Wetzels M, Schroder GO, Oppen CV (2009) Using PLS path modelling for assessing hierarchical construct models: guidelines and empirical illustration. Manag Inf Syst Q 33(1):177–195
Wold H (1966) Estimation of principal component and related models by iterative least square. In: Krishnaiah PR (ed) Multivariate analysis. Academic Press, New York, pp 391–420
Wold H (1982) Soft modeling: the basic design and some extensions. In: Joreskog KG, Wold H (eds) Systems under indirect observations (part II). North-Holland, Amsterdam, pp 1–54
Wold H (1985) Partial least squares. In: Kotz S, Johnson NL (eds) Encyclopedia of statistical science 6. Wiley, New York, pp 581–591
Zapata C, Nieuwenhuis P (2010) Exploring inovation in automotive industry: new technologies for cleaner car. J Clean Prod 18(2010):14–20
Acknowledgements
The author acknowledges the funding support of Ministry of Research, Technology and Higher Education of Indonesia through Ristekdikti Scholarship scheme which made the study possible. I would like to thank my main supervisor, Professor Tetsuo Umemura, for his guidance, patience, and precious feedback. Also, I wish to express my gratitude to board supervisors Professor Kiyoshi Fujikawa and Professor Masakazu Someya who helped and inspired me during the discourse of this research. Finally, I would like to thank all my friends who helped and encouraged me during the tough research field: Mbak Ana and Mas Lilik. I benefitted data from Mr. Dr. M. Kosasih, Chairman of KIKO (Indonesian Automotive Component Industry Cooperative), Mrs. Ir. Rosalina Faried, chairwoman of PIKKO (Medium-Sized Automotive Component Companies of Indonesia), Mr. Kukuh Kumara, Secretary General of GAIKINDO (the Association of Indonesia Automotive Industries), Mr. Ir. I Made Dana Tangkas, MSc, Director of Toyota Motor Manufacturing Indonesia (TMMIN), and Mr. Ir. Ady Rosdarmawan, General Manager Engineering, Logistics & Procurement of Hyundai Indonesia Motor (HIY) who kindly responded to my interviews and shared insightful comments for this study.
Funding
This study was supported by Ristekdikti Scholarship (BPPLN 2014), Ministry of Research, Technology and Higher Education of Indonesia.
Author information
Authors and Affiliations
Contributions
The main contribution of the study, despite the fact that there are some limitations in this research, is that this study is industrial research that collected primary data in the real field. The research gathered primary data that no previous research had collected before. Author expects that the study contributes to the current literature to some extent in several areas, especially comprehensive study on vertical relation among assembler–tier-1–tier-2 component companies in automotive field, emphasizing technology transfer and technical exchange to supplier performance improvement and, also the government role (of Indonesia) in automotive industry. The unique contributions of the study: first, previous study usually focuses on the vertical buyer–supplier relation between assembler and tier-1 companies. In this study, author exercised and included tier-2 companies as respondents; second, the study not merely focused on the buyer–supplier relation and, however, also exercised the role of government in the same time. The study that the author conducted is still rare in the context of Indonesia. The author read and approved the final manuscript.
Corresponding author
Ethics declarations
Competing interests
The author declares that there is no competing interest on financial, professional, and personal interests that might have influenced the work described in the manuscript.
Additional information
Publisher's Note
Springer Nature remains neutral with regard to jurisdictional claims in published maps and institutional affiliations.
Appendix
Appendix
1.1 Average variance extracted (AVE)
where AVE average variance extracted, λi loading factor point i, and \(\text{var} \left( {\varepsilon_{i} } \right)\) = variance of error point i (Henseler et al. 2015).
1.2 Cronbach’s alpha
whereα = Cronbach’s alpha, k = number of indicators,\(\sigma i^{2}\) = variance of indicator point i, where i = 1…k, and \(\sigma^{2} t\) total variance of set indicator’s (Cronbach 1951).
1.3 Composite reliability
where \(\rho_{\text{c}}\) composite reliability and \(\lambda_{i}\) = loading factor point i, where i = 1…k (Henseler et al. 2015).
1.4 R-square value
where SS = sum square.
1.5 Goodness of fit (GoF)
where \({\text{com}} = \frac{1}{k}\sum \lambda_{i}^{2}\), \({\text{GoF}}\) = goodness of fit, \(\overline{\text{com}}\) = average of communality, \(\lambda_{i}\) = loading factor point i, and \(k\) = number of indicators (Henseler and Sarstedt 2013; Chin 2010).
1.6 t test
t = t value, \(\gamma\) = path coefficient, and SE = standard of error.
1.7 Algorithm of partial least squares
Algorithm of PLS-PM involves a few steps. The steps of the algorithm are as follows (Monecke and Leisch 2012):
-
1.
Step 1 Initialization
-
2.
Step 2 Approximation
-
3.
Step 3 Outer approximation
-
4.
Step 4 Calculation of factor score
-
5.
Step 5 Convergence, if failed back to step 2 (approximation).
1.7.1 Formula and equation
Inner model formula
Outer model formula:
Rights and permissions
Open Access This article is distributed under the terms of the Creative Commons Attribution 4.0 International License (http://creativecommons.org/licenses/by/4.0/), which permits unrestricted use, distribution, and reproduction in any medium, provided you give appropriate credit to the original author(s) and the source, provide a link to the Creative Commons license, and indicate if changes were made.
About this article

Cite this article
Syah, D.O. Identifying vertical partnership among automotive component companies: empirical evidence from automotive industry in Jabodetabek, Indonesia. Economic Structures 8, 33 (2019). https://doi.org/10.1186/s40008-019-0149-z
Received:
Revised:
Accepted:
Published:
DOI: https://doi.org/10.1186/s40008-019-0149-z
Keywords
- Technology transfer
- Technical exchange
- Government role
- Supplier performance improvement
- Automotive industries in Jabodetabek, Indonesia