- Research
- Open access
- Published:
Evaluation of interrelatedness of cities in the territorial space of Russia
Journal of Economic Structures volume 11, Article number: 24 (2022)
Abstract
The purpose of the article is to carry out the analysis of interrelatedness of cities in the territorial space of Russia. The evaluation method is based on the calculation of global and local Moran's indexes for determination of interrelatedness of the adjacent territories by the following parameters: "population size", "population density", "average monthly salary", "shipping volume per capita". Represented as the study object were cities of the Volga Federal District of Russia with a population size over 100 thousand people in 2017. As a result of the calculations performed the leading cities were determined for all researched parameters. The quantitative evaluations obtained by the authors can be used for investigation of the leading cities effects and determination of the region development strategies.
1 Introduction
Cities, as the most concentrated spheres of human activities, are the main spatial forms of the modern social and economic development. Under the influence of globalization and rapid urbanization a lot of changes take place in the urban territorial planning, forms and organizational structure. As a result, a system of urban hierarchy is created in the country regions, consisting of large, average and small cities with different functions, which propels social and economic disparity and differentiation by living standards.
The necessity in development of the basis for regional policy and strategies of spatial development has determined the importance of cities research in the present scientific agenda. In order to make efficient and scientifically substantiated managerial decisions it is necessary to understand mechanisms, conditions and factors underlying the cities functioning, which makes the investigation of their interrelatedness in the territorial space of regions and the country on the whole actual.
Research hypothesis: In the settlement system of Russia the differentiated spatial effects of the geographically adjacent territories are observed which can serve as indicators at creation of the regional development strategy.
The purpose of this research is to evaluate a degree of the cities interrelatedness in the territorial space of Russia.
2 Theory
The theme of spatial development of cities is a subject of systematic and active research at the present stage of scientific development. In the foreign scientific literature at the close of the twentieth century the urban agglomeration economies distinguished as a sphere of knowledge from the new economic geography became popular. The economists try to explain the role of city size (population size) in the economic efficiency and to evaluate interrelatedness of cities. The fundamental principle of theoretic models is that not only the significant part of population, but also the economic activity is concentrated in the industrially developed cities, and the urban structure is a results of dynamic interaction of economic activity and city growth process (Gabaix 1999; Cyrdoba 2008a, b; Duranton 2007).
A. Anas proposed a model with the endogenous number of cities where their disappearance and appearance is allowed, the urban system development trajectory is determined for the fixed population size. The key result of this model is the conclusion on the bell-shaped dependency between the population and size of a city. The small cities are optimal for the very low and very high population size (Anas 2004). Rossi-Hansberg and Wright proposed a model of city growth based on the exogenous shocks of productiveness peculiar to each branch of production. At occurrence of such shock the production volume and, consequently, the size of cities specializing in this branch increase. The urban system in which migration facilitates city growth will make it possible to eliminate local growing returns to scale, which gives permanent returns to scale for the whole urban system in aggregate (Rossi-Hansberg et al. 2007). Brülhart and Sbergami carry out evaluation of the agglomeration process influence on the products output in the country, determine negative or positive effects of interaction within the urban agglomeration (Brülhart et al. 2009).
In 2002, Paulsen has created for the first time a coordinated set of data on urbanized territory for all metropolitan cities of the USA, has evaluated the cross models of city spatial extension determinants (Paulsen 2012). Camagni et al. make attempt in 2012 to determine the optimal city size. The scientists have represented a model of the equilibrium size of cities based on the urban disadvantages and advantages combining the elements proposed both in the traditional literature and in the updated approaches taking in to account the environment quality, urban pattern and inter-city cooperation networks. The empirical results make it possible to identify "equilibrium" city sizes (Camagni et al. 2013).
The most popular is the theory of city growth represented in the studies of Eeckhout (2004), Partridge et al. (2008), Schluter and Marsel (2013), Lalanne and Zumpe (2015). The models of city growth are based on the balance of advantages and disadvantages of agglomeration, economic forces, such as occupation, transport expenditures, market potentials, technological innovations. A number of models propose similar deterministic factors being of a fundamental value for explanation of a complex dynamics of relations between urban hierarchies.
Levinson studied the influence of internal environment of a city on its productivity. The comparative analysis of a set of variables of the ground transport network structure (connectivity, hierarchy, periphery, tree-likeness, entropy, accessibility) in 50 largest metropolises of the USA has shown how a network value and structure depend on the city size. The obtained results underline that the large cities are more interconnected physically (Levinson 2012). Arribas-Bel and Sanz-Gracia use local indicators of the spatial association and other methods of econometric analysis to evaluate distribution of centers with high density of occupation within the metropolises. Analyzing the selection of 359 metropolises of the USA (research period 1990, 2000 and 2010) the scientists made the following conclusions:
-
(1)
mono-centric structure retains in the majority of metropolises: 56.5% in 1990, 64.1% in 2000 and 57.7% in 2010;
-
(2)
the occupation center structure remains stable for the majority of metropolises: a number of centers was unchanged for 74.9% of metropolises during 1990–2000 and for 85.2% during 2000–2010;
-
(3)
as compared to mono-centric metropolises the poly-centric metropolises are larger and more dense, with high income per head and low poverty datum line (Arribas-Bel 2014).
The problem of allocation and development of cities in the spatial economy becomes actual in the studies of Russian scientists in the beginning of twenty-first century. Treivish has carried out evaluation of dynamics of a rank of Russian cities from 1967 to 2002 and has concluded that the ranks are by and large retained (Treivish 2009). This conclusion confirms the stability of the urban system in Russia. Arkhipov has developed the functional typology of cities with selection of features: functional structure development degree, territorial content of functions, economical and geographical position (Arkhipov 2010). Andreyev evaluates allocation of cities in the Volga Federal District with the use of the Zipf's law (Andreyev 2014). Kolomak has represented the empirical regularities of the urban system development in Russia, has analyzed the urbanization level, and has proposed the econometric evaluations of the urban system development factors (Kolomak 2018).
However, until the present, the crudity of individual theoretical and practical aspects of city development in the spatial economics takes place, in particular, the adaptive techniques of the cities interrelatedness and distribution regularity investigation in the territorial space of Russia are absent, evaluation methods of their allocation efficiency and functioning are not developed, which does not make it possible to determine correspondence of the economical, social and political goals in the spatial development.
3 Data and methods
The goal of this study can be achieved on the basis of methodical tool of the spatial autocorrelation evaluation with the use of the Moran's index. Chen has shown four approaches to calculation of the Moran's index, which contributed to development of the spatial autocorrelation analytical process (Chen 2013). Pavlov and Koroleva apply the local and global Moran's index for identification of clusters and sub-clusters (Pavlov et al. 2014). Rusanovsky and Markov use the Moran's index for measurement of the unemployment spatial localization. This index gives correct results in regard to complex systems when the relations between the adjacent territories have a linear character (Rusanovsky et al. 2016). Suvorova, while calculating the global and local Moran's index, has developed an approach of identification of direct and reverse effects of the development of growth poles, and has measured the extent of their influence on the adjacent territories (Suvorova 2019). The spatial autocorrelation makes it possible to evaluate the availability of spatial effects occurred as a result of establishment of interrelatedness between the study objects.
Figure 1 shows the author's algorithm for evaluation of spatial interrelatedness of RF cities with the use of the Moran's index.

Algorithm for evaluation of spatial interrelatedness of Russian cities
-
(1)
At the first stage it is necessary to acquire statistical data and build a matrix containing the data on distances between the territorial units being investigated. The distance matrix will be built with account of information on a length of motor roads between RF cities.
-
(2)
Calculate the global Moran's index:
$${I}_{G}=\frac{N}{{\sum }_{i}\sum_{j}{w}_{ij}}*\frac{\sum_{i}\sum_{j}wij\left({x}_{i }-\mu \right) \left({x}_{j }-\mu \right)}{{\sum }_{i}{\left({x}_{i}-\mu \right)}^{2}},$$(1)where IG, the global Moran's index; N, a number of cities; wij, an element of spatial weight matrix for regions i and j; µ, an average value of parameter; and x, parameter being analyzed.
-
(3)
Determine the index mathematical expectation:
$$E\left(I\right)=\frac{-1}{\mathrm{n}-1},$$(2)where E(I), an index mathematical expectation, n, a number of territories being analyzed.
-
(4)
Compare the obtained Moran's index with the mathematical expectation. Make a conclusion on the availability and the character of spatial autocorrelation.
IG ≥ E(I), positive spatial autocorrelation (values of the considered parameter for nearby cities are similar); IG ≤ E(I), negative spatial autocorrelation (values of the considered parameter for adjacent cities differ), IG = E(I), no spatial autocorrelation.
-
(5)
Check the significance of the obtained results with the use of the statistical hypothesis check method (z-test) by determining the z-statistics value:
$$z\mathrm{-statistics }=\frac{I-E\left(I\right)}{\sqrt{E({I)}^{2}}-E{\left(I\right)}^{2}}.$$(3)The obtained value determines a number of standard deviations by which the actual value of the Moran's index is subtracted from the expected value.
-
(6)
Create the Moran's spatial scatter diagram. At the x-axis—standardized z-values of the parameter is studied, at the y-axis—the value of spatial factor Wz. Shown in the diagram is a regression line of Wz to z the slope of which is equal to the total spatial autocorrelation coefficient I at the standardized weight matrix (Vakulenko 2013). The spatial autocorrelation coefficient shows a degree of the linear interrelation between a vector z of the centered values of the parameter under study and a vector Wz of the spatially weighed centered values of the parameter under study in the nearby cities (Vakulenko 2013). The axes of the Moran's spatial scatter diagram are given in Fig. 2.
Fig. 2 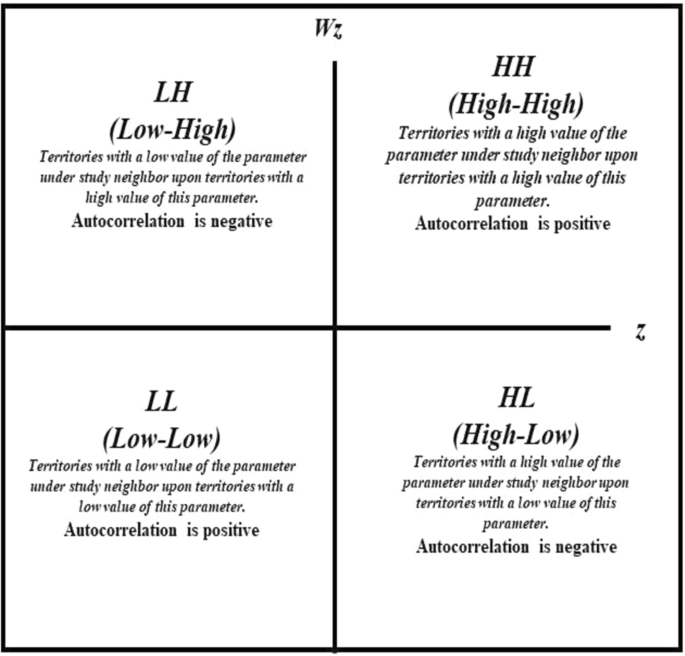
Spatial scatter diagram of the Moran's index. LH square: cities located in this square have relatively low values of the parameter being analyzed and are surrounded by cities with relatively high values of the parameter being analyzed. HH square: extreme cities have relatively high values of the parameter being analyzed and is adjacent to the cities which also have relatively high values of the parameter being analyzed. LL square: cities located in this square have relatively low values of the parameter being analyzed and are surrounded by cities which also have relatively low values of the parameter being analyzed. HL square: cities located in this square have relatively high values of the parameter being analyzed and are surrounded by territories with relatively low values of the parameter being analyzed
-
(7)
Calculate the value of the local Moran's index (LISA – Local Index Spatial Autocorrelation) and determine a degree of interrelatedness of a certain city with all the others.
$${I}_{{L}_{i}}={z}_{i}\sum {w}_{ij}{z}_{j},$$(4)where ILi, local Moran's index for ith city; wij, standardized distance between ith and jth city; zi and zj, standardized values of the parameter under study for ith and jth city. The obtained values can be from -1 to 1.
At ILi < 0, autocorrelation for city i is negative, i.e., this city significantly differs from the nearby cities by the parameter under study (outlier).
At ILi < 0, autocorrelation is positive, i.e., this city is similar to the nearby cities by the parameter under study (cluster).
At | ILi | >| ILj |, similarity/differences of cities i as compared to the surrounding nearby cities is more than that in case of a city j and its neighbors.

Evaluation of the spatial autocorrelation will make it possible to identify and measure the interrelatedness between the cities and to distinguish the leaders (by scale of parameters and influence force).
In order to carry out the study, the selection was generated and composed of the cities in the Volga Federal District of Russia with a population size over 100,000 people. Parameters being analyzed: "population size", "population density", "average monthly salary", "shipping volume per capita".Footnote 1 Period of investigation—2017. The data of the Federal Service of State Statistics were used as the information source; the calculation of distances was carried out as per the automotive portal data.Footnote 2.
4 Results of research and discussion
The parameters being analyzed in the research are the resulting parameters of the social and economic development of a city.
The parameters of the population size and density are indicators of city development successfulness. The authors have determined practicability of simultaneous analysis of these two parameters. The population size is indicative of the city size, the population density is indicative of the spatial concentration and the scale effect indicates the economic yield size. The value of the average monthly salary determines the material security level of the working-age population and is one of the criteria of the city’s attractiveness. The shipping volume per capita determines the scales and successfulness of the city’s economic activities. Table 1 shows the parameters that are being analyzed.
A great imbalance is observed by the parameters being analyzed in the cities of the Volga Federal District. The population size varies from 102.1 thousand people (Novokuibyshevsk) to 1259 thousand people (Nizhny Novgorod); population density—from 331.9 men per km2 (Berezniki) to 3034.4 men per km2 (Arzamas); average monthly salary—from 23,689 RUB (Novocheboksarsk) to 41,600 RUB (Almetyevsk); shipment volume per capita—from 149.5 thousand (Balakovo) to 4060.698 thousand (Almetyevsk).
Figures 3, 4, 5, 6 show spatial scatter diagrams of the global Moran's index by the parameters being analyzed in the cities of the Volga Federal District in 2017. Tabular representation of the local Moran's index is given in Tables 2, 3, 4, 5.

Moran's spatial scatter diagram (population size) for cities of the Volga Federal District of Russia in 2017 (Russian regions. Main social and economic parameters of cities. 2018 // Federal Service of State Statistics [Electronic resource] URL:http://www.gks.ru/free_doc/doc_2018/region/reg-gor18.pdf (date of application 07.02.2020).)

Moran's spatial scatter diagram (population density) for cities of the Volga Federal District of Russia in 2017 (Russian regions. Main social and economic parameters of cities. 2018 // Federal Service of State Statistics [Electronic resource] http://www.gks.ru/free_doc/doc_2018/region/reg-gor18.pdf (date of application 07.02.2020).)

Moran's spatial scatter diagram (average monthly salary) for cities of the Volga Federal District of Russia in 2017 (Russian regions. Main social and economic parameters of cities. 2018 // Federal Service of State Statistics [Electronic resource] URL:http://www.gks.ru/free_doc/doc_2018/region/reg-gor18.pdf (date of application 07.02.2020).)

Moran's spatial scatter diagram (shipping volume per capita) for cities of the Volga Federal District of Russia in 2017 (Russian regions. Main social and economic parameters of cities. 2018 // Federal Service of State Statistics [Electronic resource] URL:http://www.gks.ru/free_doc/doc_2018/region/reg-gor18.pdf (date of application 07.02.2020).)
At the evaluation of the spatial interrelatedness in the Volga Federal District the cities achieved the global Moran's index by the parameter "population size" − 0.2 with the mathematical expectation of − 0.03. So, we can make a conclusion on the availability of negative autocorrelation by this parameter. Therefore, the change in the indicator under consideration (population) in the transition from city to city is significantly different. At the same time, the presence of three leaders is clearly visible—Nizhny Novgorod, Kazan and Samara, which are not only characterized by a high population, but also have an impact on the cities surrounding them: the points that display them are significantly located to the right of the main array.
Two cities—Kirov and Togliatti, belong to the group HH—these are territories, that according to the values of the indicator under consideration, are comparable with the surrounding regions. They are elements of the area of the concentration of inhabitants.
The low value of the local Moran's index indicates the absence of its significant influence on the surrounding cities.
Twelve cities belong to the extreme territories included in the group HL and possess the significant (as compared to the nearby territories) values of the parameter under study. The maximum values of the local Moran's index are obtained for Nizhny Novgorod (LISA − 0.021), Samara (LISA − 0.033) and Kazan (LISA − 0.01). Twelve cities belong to a group of territories with a relatively low population size, surrounded by the cities with a relatively high value of this parameter (LH square). Almost all the constituents of this group are in the influence area of the HL group cities which are their regional centers. The LL group (cities that are not influenced by the surrounding entities that fell into the field of the study, and are not themselves leaders) includes two cities of the Republic of Bashkortostan, one city of the Republic of Mordovia and one city of the Republic of Tatarstan.
Evaluation of the spatial interrelatedness performed on the basis of the population density analysis in the cities of the Volga Federal District, is indicative of the availability of reverse effects between the values of these parameters on the nearby territories. Such conclusions are obtained by the results of comparing the global Moran's index (− 0.07) with its mathematical expectation (− 0.03). The majority of the total number of cities is taken into account with the positive autocorrelation (HH square). These are predominantly the cities in the central part of the federal district. The highest value of the local Moran's index is obtained for Novocheboksarsk (LISA 0.008) and Yoshkar-Ola (LISA 0.005). Included in the group of territories with relatively high values of population density, that is surrounded by the constituents having relatively low values of the parameter under study (HL square), are seven cities of which six are regional centers, that act as points of agglomeration attraction for the region’s population.
The maximum value of the local Moran's index was obtained for Nizhny Novgorod (LISA − 0.01). Eleven cities belong to the territories falling under influence of HL group (LH square). Two regional centers moved into LL group: Ufa and Perm.
The empirical results obtained and the graphical representation of the grouping of cities are in accordance with their role in the regional system of settlement, presented in Figs. 3, 4. The figures indicate the presence of a correlation between the indicators of the number and density of the population living in the neighboring territory. An analysis of the cohesiveness of relationships between individual cities shows that the influence of regional capitals on nearby cities can be considered significant. At the same time, these relationships are predominantly opposite, that is, there is a migration of the population to the center of the region from the periphery, thereby increasing demographic asymmetry and socio-economic inequality.
Today in Russia, migration is the main factor in the growth of million-plus and large cities (capitals of regions), there are processes of population converging to points of agglomeration attraction, similar conclusions were obtained in the works of Zubarevich (2017), Suvorova (2019) and Makarova (2021).
The analysis of the spatial interrelatedness in the cities of the Volga Federal District by the parameter "average monthly salary" has shown the availability of the direct relation (global Moran's index 0.08, mathematical expectation − 0.03), which means the relative spatial uniformity of the average monthly wage.
In the group of cities with a relatively high value of the parameter under study nine cities are surrounded with territories with a relatively high level of average monthly salary (HH square) and three cities—with a relatively low value of average monthly salary (HL square). The highest indicator of the cohesiveness of the spatial mutual influence of the surveyed cities is − 0.015 (Nizhny Novgorod). The maximum concentration of cities by the parameter under study is observed in square LL, which confirms the high prevalence of relatively low average monthly wages, while the links between them are weak (seen by the distance between the points).
The global Moran's index (0.02) obtained by calculations and its comparison with the mathematical expectation (− 0.03) demonstrated the availability, of positive autocorrelation in the cities of the Volga Federal District by the parameter "shipping volume per capita". An analysis of the distribution of cities that fell into different groups (HH, HL, LL, LH) across the territory of the federal district indicates a high degree of polarization. Two leading cities have been identified: Almetievsk and Nizhnekamsk.
The points that show these cities are located further to the right of the main array; high values of the local Moran's index are obtained by calculations. This result is explained by that the large oil companies, such as "Tatneftedor", "Bulgarneft", "SMP-Neftegas", are located on the territory of Almetyevsk. Nizhnekamsk has a status of "mono-city"; the city-forming branch is petrochemical, oil-refining and energy generating industries. Seven cities in total having relatively high values of the parameters under study are located in the territory of the Volga Federal District: four in HH square, three in HL square, all these cities are industrial centers of Russia, in this territories there are enterprises of the oil-refining and petrochemical industries (Salavat, Almetyevsk, Nizhnekamsk, Ufa, Perm), mechanical engineering and automotive industry (Tolyatti, Ufa, Perm) and chemical industry (Ufa, Perm, Berezniki).
Sixteen cities have relatively low values of the parameters under study and are surrounded by the territories also having low shipping volumes per capita (LL square), including the city Nizhny Novgorod with one million population. The LH group includes eleven cities, two of which have a million-plus population (Kazan and Samara). Thus, the million-plus cities of the Volga Federal District are not leaders in terms of industrial production, which is logical and natural. The role of the center of industrial production is determined primarily by the structure of the economy of the settlement and the leading industry. Researchers rightly note that the level of territorial cooperation of subjects is determined not by geographical, but by the organized proximity (based on similarity, belonging to a single system of relations) (Pozhidaev 2019), which is confirmed in this study.
According to the results of the investigation performed, the leading cities and the sphere of their interrelatedness is determined. The constituents in HH and HL squares, having the value of the local Moran's index by modules higher than the modules of the average calculated local Moran's indexes, belong to the leading cities. Cities in the LH square, in which the value of the local Moran index by module higher than the module average value of the calculated local Moran indices of the leading city, relative to which the assessment is made, were in the zone of their influence (Table 6).
Leaders by population size were cities with a million-plus population (except for Saratov). Their interrelatedness area predominantly includes cities of the central part of the Volga Federal District.
Five leading cities from different regions (the republics of Bashkortostan, Tatarstan, Chuvashia; Nizhny Novgorod and Samara regions) of the federal district under study by the parameter "population density" were determined by calculation. Dzerzhinsk and Novokuibyshevsk to different extents became simultaneous to the interrelatedness of two leading cities. It is logical that this relation is stronger towards subordinate cities in their regional areas.
The leader by average monthly salary level and shipping volume per capita is Nizhnekamsk, the city of the Republic of Tatarstan. Its interrelatedness area covers the cities of the republics of Tatarstan (Nizhnekamsk, Naberezhnye Chelny, Kazan), Bashkortostan (Oktyabrsky), Udmurtia (Izhevsk) and Orenburg region (Orsk). It is notable that the local Moran's index for this city is higher by the parameter "shipping volume per capita". This result is conditioned by the city-forming branch (petrochemical, oil-refining and energy generating industries) in the city of Nizhnekamsk with the relatively low population size (237.9 thousand people).
The second leading city by the parameter "shipping volume per capita" is Almetyevsk (the Republic of Tatarstan). In the interrelatedness area of which the cities of the republics of Tatarstan (Kazan), Bashkortostan (Neftekamsk, Oktyabrsky), Udmurtia (Izhevsk) and the regional center Samara are included.
As we can see, the maximum number of relations is determined in regard to the cities of the republics of Tatarstan and Bashkortostan. It should be noted, that these constituents of the Russian Federation have similar structures of GRP and market place prospects. The enterprises of the petrochemical complex and motor-car construction are concentrated in the territories thereof.
5 Conclusion
The performed analysis of the spatial interrelatedness of cities with the use of the Moran's index allows the following conclusions:
-
(1)
The socio-economic space of the Volga Federal District as a whole and its regions in particular can hardly be called unified. The magnitude of inter-city differentiation and the values of resource concentration parameters and spatial autocorrelation coefficients indicate their fragmentation.
-
(2)
No polarization is observed in the cities of the Volga Federal District by the parameters "population size", "population density" and "average monthly salary". The following polarization takes place by the parameter "shipping volume per capita". Nizhnekamsk and Almetyevsk are subtracted from the rest of the group of cities. The role of the center of industrial production is determined by the structure of the economy of the settlement and the leading industry, not by the population of the city.
-
(3)
The strongest inter-territorial relations (negative autocorrelation) are revealed by the parameter "population size" for Saratov (LISA − 0.18). The adjacent city Engels (11 km) being in the regional subordination is influenced thereof. It appears probable that the outflow of population takes place from Engels to Saratov. Thus, the previously obtained results of a number of Russian scientists (Zubarevich 2017; Suvorova 2019; Makarova 2021) have been confirmed regarding the fact that in Russia, migration is the main factor in the growth of million-plus cities and large cities (capitals of the regions). There are processes of the population merging into points of agglomeration attraction.
-
(4)
The territorial proximity to the leading cities facilitates the outflow of resources and aggravation of the inter-territorial differentiation, which makes it possible to think of the impracticality of outstripping the constituent’s development due to their negative action on the economic systems in the region.
-
(5)
In order to decrease the inter-regional social and economic differences in Russia it would make sense to develop the territories neighboring the leading cities. Modernization of infrastructure and active social policy of living standards improvement, makes it possible to attract young specialists to cities, which will facilitate the stable development of regions and the country as the whole. The factor determining the domicile selection by the working-age of the population is the availability of work places, the salary level of which meets the requirements of employees. It is important to emphasize that the mentioned measures should be carried out in the whole territory of the Russian Federation in order not to increase irregularity and isolation of individual regions.
-
(6)
The analysis of the social and economic parameters ("population size", "population density", "average monthly salary" and "shipping volume per capita") has shown the availability of spatial effects which can be used in the elaboration of the cities and regions development strategy in part of the determination of the potential market for the products and the creation of production clusters in the region.
-
(7)
The represented evaluation method of spatial interrelatedness of the territories has potential for further development. The detailed analysis of the local Moran's index components (LISA), for the city will make it possible to determine the availability and degree of its interrelations with all selected territories by the parameters being analyzed. The research of the autocorrelation in dynamics and detection of spatial–temporal shifts is of interest, which will be a topic of future studies.
-
(8)
Empirical results and conclusions complement the series of works by Russian scientists in the study of the spatial organization of the region's economy (Lavrikova et al. 2020; Naumov 2019 and others), and the Moran's index as a tool for assessing spatial autocorrelation (Vakulenko 2013; Ivanova 2014; Pavlov et al. 2014; Rusanovsky et al. al. 2016).
Availability of data and materials
The datasets for the present study are available publicly.
Notes
By types of activity: extraction of mineral resources, processing production, generation of electric energy, gas and water.
Automotive Portal of Cargo. Available at: www.avtodispetcher.ru
References
Anas A (2004) Vanishing cities: what does the new economic geography imply about the efficiency of urbanization? J Econ Geogr 4(2):181–199
Andreev VV, Lukiyanova VYu, Kadyshev EN (2017) Analysis of the territorial distribution of the population in the constituent entities of the Volga Federal District using the Zipf and Gibrat law. Appl Econ 48:97–121
Arkhipov AM (2010) Functional typology of cities in Central Russia. Acad Herald 2:47–51
Arribas-Bel D, Sanz-Graci F (2014) The validity of the monocentric city model in a polycentric age: US metropolitan areas in 1990, 2000 and 2010. SSRN Electron J 35(7):1–12
Brulhart M, Sbergami F (2009) Agglomeration and growth: Cross-country Evidence. J Urban Econ 65:350–362
Camagni R, Capello R, Caragliu A (2013) One or infinite optimal city sizes? In search of an equilibrium size for cities. Ann Reg Sci 51(2):309–341
Córdoba J (2008a) C. On the distribution of city sizes. J Urban Econ 63:177–197
Córdoba JC (2008b) A generalized Gibrat’s law. Int Econ Rev 49:1463–1468
Chen Y (2013) New Approaches for Calculating Moran’s Index of Spatial Autocorrelation. https://journals.plos.org/plosone/article?id=https://doi.org/10.1371/journal.pone.0068336. Accessed 15 Feb 2020
Duranton G (2007) Urban evolutions: The fast, the slow, and the still. Am Econ Rev 97:197–221
Eeckhout J (2004) Gibrat’s law for (all) cities. Am Econ Rev 94:1429–1451
Gabaix X (1999) Zipf ’s law for cities: an explanation. Quart J Econ 114(30):739–767
Ivanova VI (2014) Regional income convergence: a spatial analysis. Spatial Economics 4:110–119
Kolomak EA (2018) The urban system of modern Russia. - Novosibirsk: Publishing House IEOPP SB RAS. p 144.
Lalanne A, Zumpe M (2015) Gibrat's law, Zipf's law and Cointegration. https://mpra.ub.uni-muenchen.de/67992/. Accessed 15 Feb 2020.
Levinson D (2012) Network Structure and City Size. PLoS ONE 7(1):1–16
Partridge MD, Rickman DS, Ali K, Olfert MR (2008) Employment growth in the American urban hierarchy: long live distance. J Macroecon 8(1):1–8. https://doi.org/10.2202/1935-1690.1627
Lavrikova YG, Suvorova AV (2020) Optimal spatial organization of the region’s economy: search for parameters and dependencies. Econ Region. 16(4):1017–1030. https://doi.org/10.17059/ekon.reg.2020-4-1
Makarova MN (2021) Modeling socio-demographic asymmetry of territorial development. Econ Soc Changes Facts Trends for 14(2):29–42. https://doi.org/10.15838/esc.2021.2.74.2
Naumov IV (2019) Study of interregional relationships in the processes of formation of the investment potential of territories using spatial modeling methods. Econ Region 15(3):720–735. https://doi.org/10.17059/2019-3-8
Paulsen K (2012) Yet even more evidence on the spatial size of cities: Urban spatial expansion in the US, 1980–2000. Reg Sci Urban Econ 42:561–568
Pavlov YuV, Koroleva EN (2014) Spatial interactions: estimation based on local and global Moran indices. Spatial Econ 3:95–110
Rossi-Hansberg E (2007) Urban structure and growth. Rev Econ Stud 74:597–624
Pozhidaev RG (2016) Evolution of the concept of proximity and current cluster policy. Vestnik VSU Series: Econ Manag 3:26–34
Rusanovsky VA, Markov VA (2016) The influence of the spatial factor on the regional differentiation of unemployment in the Russian economy. Prob Forecasting 5:144–157
Schluter C, Marseille A (2013) Gibrat, Zipf, Fisher and Tippett: City Size and Growth Distributions Reconsidered Universit´e. Aix Marseille School of Economics. CNRS & EHESS and University of Southampton Mark Trede† Universit¨at M¨unster. https://www.wiwi.unimuenster.de/cqe/sites/cqe/files/CQE_Paper/CQE_WP_27_2013.pdf. Accessed 15 Feb 2020
Suvorova AV (2019) Development of growth poles in the Russian Federation: direct and inverse effects. Eco Soc Changes Facts Trends Forecast 12(6):110–128
Treyvish A (2009) City, district, country and world. The development of Russia through the eyes of a country expert. New Chronograph. 369:89
Vakulenko ES (2013) Introduction to spatial econometrics / M.: HSE. http://pokrovka11.files.wordpress.com/2013/01/spatial_econometrics.pdf. Accessed 01 Jan 2020
Zubarevich NV (2017) Development of the Russian space: barriers and possibilities of regional policy. World New Econ 2:46–57
Acknowledgements
Not applicable.
Funding
The work was supported by the Russian Science Foundation, project No. 22-28-00209.
Author information
Authors and Affiliations
Contributions
IM developed the idea and supervised the writing of the manuscript. AK collected statistical information. SR was engaged in data analysis and obtaining results. All authors read and approved the final manuscript.
Corresponding author
Ethics declarations
Competing interests
The authors declare that they have no competing interests.
Additional information
Publisher's Note
Springer Nature remains neutral with regard to jurisdictional claims in published maps and institutional affiliations.
Rights and permissions
Open Access This article is licensed under a Creative Commons Attribution 4.0 International License, which permits use, sharing, adaptation, distribution and reproduction in any medium or format, as long as you give appropriate credit to the original author(s) and the source, provide a link to the Creative Commons licence, and indicate if changes were made. The images or other third party material in this article are included in the article's Creative Commons licence, unless indicated otherwise in a credit line to the material. If material is not included in the article's Creative Commons licence and your intended use is not permitted by statutory regulation or exceeds the permitted use, you will need to obtain permission directly from the copyright holder. To view a copy of this licence, visit http://creativecommons.org/licenses/by/4.0/.
About this article

Cite this article
Manaeva, I., Rastvortseva, S. & Kanishcheva, A. Evaluation of interrelatedness of cities in the territorial space of Russia. Economic Structures 11, 24 (2022). https://doi.org/10.1186/s40008-022-00288-2
Received:
Revised:
Accepted:
Published:
DOI: https://doi.org/10.1186/s40008-022-00288-2